

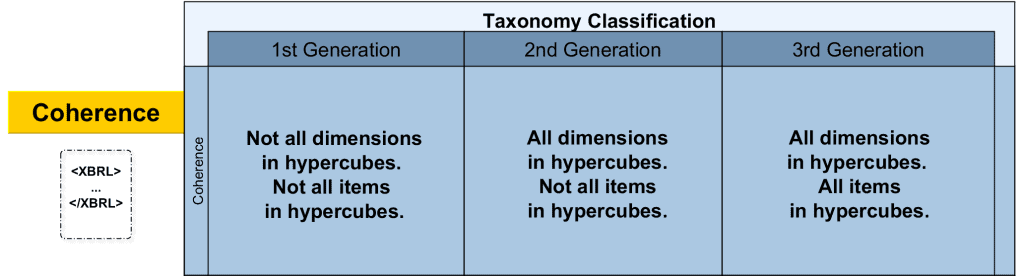
In this series of articles, we propose a categorisation of taxonomies based on different aspects of their design. Using this categorisation we look at the evolution of taxonomy design through three generations.
What is taxonomy coherence?
Our dictionary provides two definitions for ‘coherence’: the quality of being logical and consistent; and the quality of forming a unified whole. Both should apply to the architecture and design of XBRL taxonomies.
We said in the introductory article of this series that by coherent we meant a taxonomy that “hangs together” to produce consistent and comparable instance documents. That’s actually extending the concept beyond the taxonomy itself to the instance documents that can be created with it, but if we can’t guarantee to produce documents with those qualities then what’s the point of a coherent taxonomy?
Hypercubes and dimensions
One useful way of comparing the coherence of taxonomies is demonstrated by the graph below, which plots dimensions per hypercube for each of the three taxonomies we are examining (note that both scales are logarithmic):
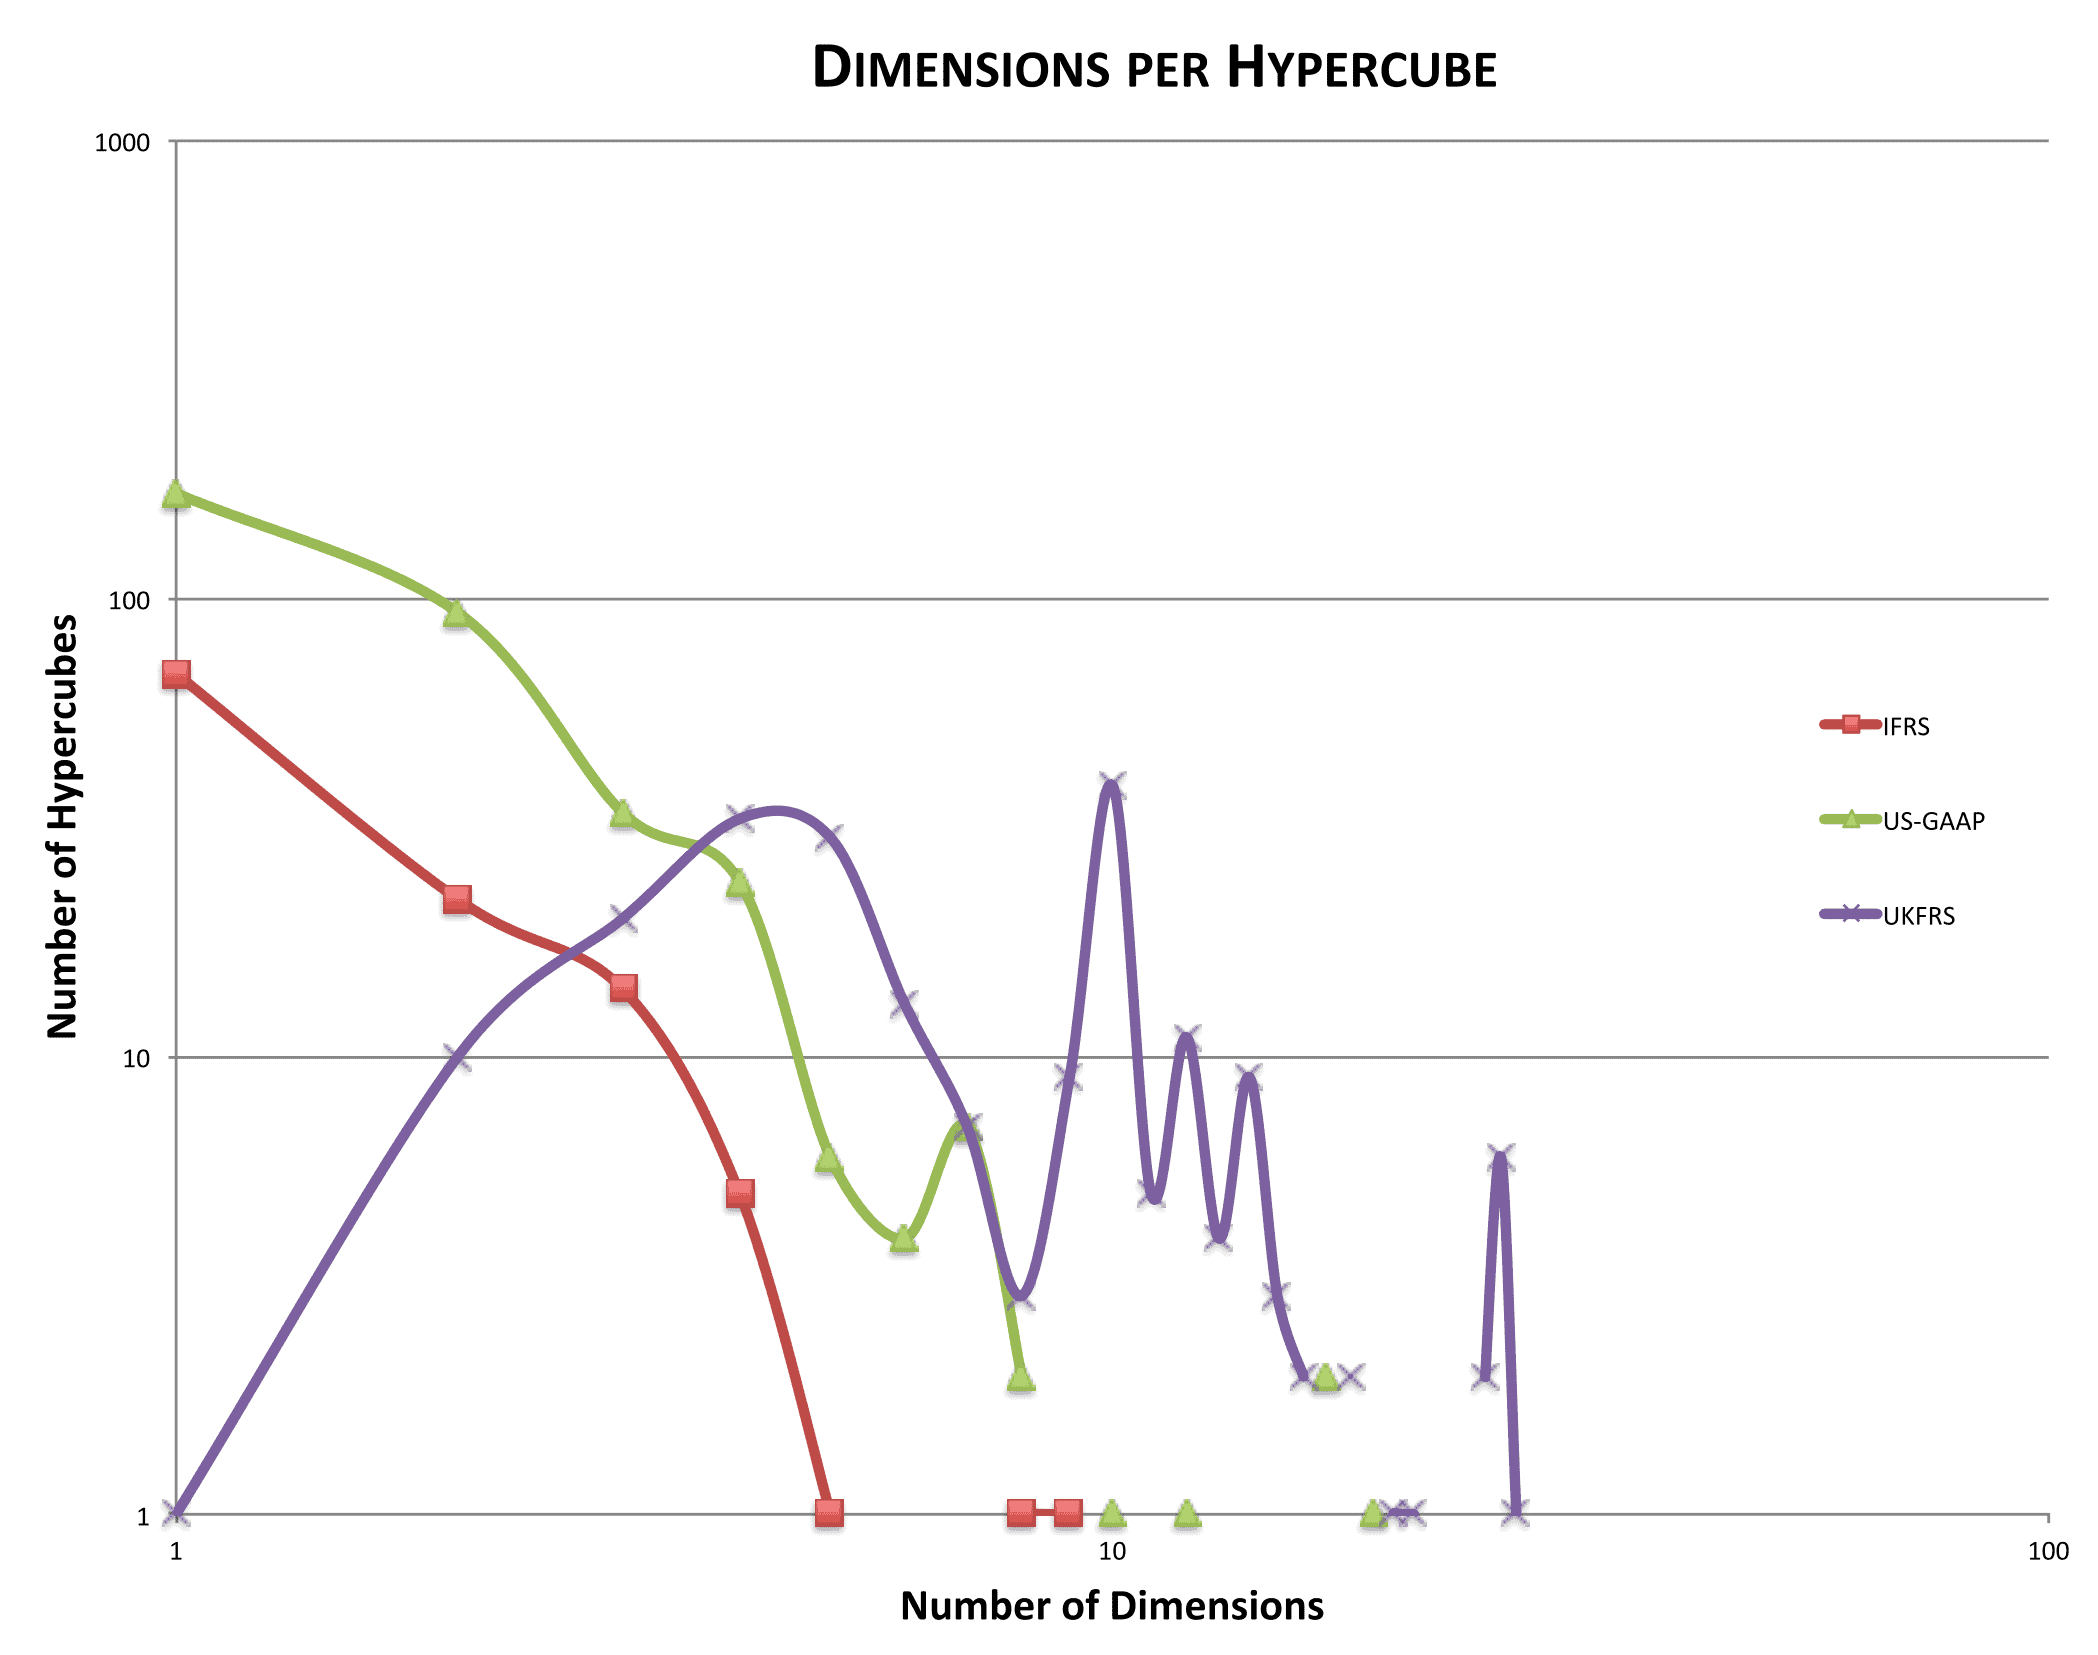
The number of dimensions per hypercube is a good measure of how extensively the taxonomy uses dimensional data modelling to provide a unified data model focused around the relationship between concepts and the data aspects that apply to them.
The difference between US GAAP (green) and IFRS (red) is simply one of magnitude – the US GAAP taxonomy (345 hypercubes, 272 unique dimensions) is approximately three times larger than the IFRS taxonomy (112 hypercubes, 113 unique dimensions). However their ‘dimensions per hypercube’ profiles are very similar, starting at a peak with one-dimensional hypercubes and diminishing quickly as the number of dimensions increases. There is a large majority (70%+) of hypercubes with one and two dimensions in both taxonomies.
The profile for UK FRS (purple) is strikingly different. There is just one hypercube with one dimension, and only ten hypercubes with two dimensions. This suggests a radically different approach to the design of the taxonomy (212 hypercubes, 115 unique dimensions) and in particular the use of hypercubes to represent highly-dimensional data.
The graph implies that, for US GAAP and IFRS, most concepts have been modelled in isolation with a small number of specialised dimensions. In contrast, the UK FRS taxonomy has been modelled comprehensively as a whole, with widely applicable dimensions being applied across numerous relevant concepts.
We will now explore in more detail the reasons behind the differences between the taxonomies.
The IFRS taxonomy
We’ve already seen that the architectural underpinnings of the IFRS taxonomy are derived from the International Financial Reporting Standards themselves.
The chief consequence of this on the design of the IFRS taxonomy is that users of it are at liberty to interpret the framework it provides very broadly. This can be to the detriment of instance document consistency and comparability.
The IFRS taxonomy is intended to act as a foundation for electronic reporting regimes in IFRS-using jurisdictions around the world. The primary ‘users’ of the taxonomy in this case are most likely taxonomy architects tasked with creating extended versions of the IFRS taxonomy suitable for local reporting purposes. This means that there is a considerable effort required on the part of the extension architects to implement a level of consistency on top of the IFRS taxonomy itself.
This “standards-first” approach shows itself in that the IFRS taxonomy has the lowest average number of dimensions per hypercube of the three taxonomies we’re examining, at just under two. This is surely the result of attempting to model the low-dimension, presentation-oriented tables commonly seen in standards documents and in the corresponding financial reports. The taxonomy also has dimensions not associated with any hypercube; and some reportable concepts are not associated with any hypercube.
By way of a small but illustrative example, consider the IFRS Earnings per share hypercube (table) which has six separate primary items and a single dimension.
Primary items:
• Basic and Diluted earnings (loss) per share from continuing operations (2 items)
• Basic and Diluted earnings (loss) per share from discontinued operations (2 items)
• Totals for both Basic and Diluted earnings (loss) per share (2 items)
Dimension:
• Classes of Ordinary Shares
There is also a “floating” dimension (axis) not associated with any hypercube – Continuing and discontinued operations – for breaking down continuing versus discontinued operations, which wasn’t utilized in the Earnings per share hypercube. Had it been, the number of Earnings per share primary items in the structure could have been reduced from six to two (Basic and Diluted earnings concepts for each of continuing, discontinued and (default) total dimension members). This demonstrates that, if a data-centric approach had been taken to model the taxonomy, it would have simplified and improved its coherence.
In summary, the IFRS taxonomy is not as coherent as it might be, and that impacts the consistency and comparability of instance documents created to adhere to it.
The US GAAP taxonomy
The US GAAP taxonomy is nearly three times the size of the IFRS taxonomy in nearly all respects, but it associates all dimensions with hypercubes, even if around one third of all reportable concepts are not associated with any hypercube. This is an approach with greater consistency than that of the IFRS taxonomy, dimensionally-speaking, even though it provides far too many degrees of freedom to instance document preparers when it comes to these “free” reportable concepts, leading to documents that may not be entirely consistent with each other or wholly comparable.
Interestingly, however, it is on a par with the IFRS taxonomy in one important respect: the average number of dimensions per hypercube is only slightly larger, at just over two. This suggests that the hypercubes (or tables in US vernacular) in the taxonomy are primarily modelling the kinds of two-dimensional tabular presentations (for human consumption!) that one might see in a financial report or defined in an accounting standard (e.g. an axis of ‘concepts’ plus one or two dimensional breakdowns).
The “document-centric” approach of US GAAP therefore tends to produce a taxonomy design that yields data structures that tend to represent the conventional tabular presentations prescribed or presented as exemplars in standards documents and in common usage by preparers of financial statements.
The rigorous architectural underpinnings of the US GAAP taxonomy have resulted in a coherent taxonomy design, although one that does not lend itself to ensuring similar consistency in instance documents, particularly due to the usage of filer taxonomy extensions, as we will discuss in a forthcoming blog.
The UK FRS taxonomy
The average number of dimensions per hypercube in the UK FRS taxonomy is much higher than either IFRS or US GAAP at just over eight. This is a key indicator of a radically different architectural approach in which data modelling has taken centre-stage. As if to emphasise this, all reportable concepts belong to a hypercube, which is a very strong indicator from the taxonomy’s architect to instance document preparers of what is expected of them. There is a coherent dimensional framework in which each and every reportable concept unambiguously sits.
The result is a collection of highly-dimensional hypercubes tightly bound to reportable concepts. With judicious use of dimensions with default members, in the main, the “tagging” task for any given reportable concept is not onerous, but at the same time the full expressive power of the hypercubes can be brought to bear when the need arises. Reportable concepts are only valid in certain well-defined circumstances, and those hypercubes have been equipped with all the necessary dimensions, whether they are actually needed in any given circumstance or not.
The UK FRS taxonomy design is based on a thorough analysis of the data that is required to be conveyed by financial statements. This results in a more coherent data model since all the potential aspects (or “dimensions”) of an item of data can be considered holistically and independently of any traditional or prescribed presentation requirements. In this approach, the typical presentations’ one- and two-dimensional hypercubes (tables) tend to be represented by one- and two-dimensional “slices” through higher-dimensional structures, and there is little or no need for preparers to expand the existing hypercubes – something that can only be achieved via entity-specific taxonomy extensions.
The coherence of the taxonomy naturally assures the consistency and comparability of instance documents. It is a consequence of the taxonomy’s design that places no unreasonable demands on the ingenuity of taxonomy extenders or instance document preparers.
Conclusion
We have seen how the different choices in taxonomy design have influenced the coherence of the taxonomies under study and how this is illustrated by the dimension-per-hypercube metric.
In general, a coherent taxonomy should have a complete, consistent data model with full hypercube coverage, broadly-applicable dimensions and no unnecessary duplication either for dimensions or concepts. We have seen that these goals are most readily achieved by taking a data-model-first approach to taxonomy design. A coherent taxonomy leads to clear, unambiguous tagging and therefore clear, comparable instance documents with less opportunity for error.
If a taxonomy has a less extensive dimensional model, this requires extenders and/or instance document preparers to provide more interpretation of the taxonomy and to work significantly harder to produce consistent, comparable instance documents. This is by no means impossible, but some of the burden has been transferred from the taxonomy authors to taxonomy extenders and/or instance document preparers, who are less able to produce coherent, comparable data if they’re not equipped with the tools to do so.
In the next blog post we’ll cover taxonomy extensibility.
I’d like to thank Tom Ford for his contributions to this post.