
As part of our drive to showcase how innovative apps can be built on the True North® Data Platform, we’ve released a new at-a-glance fraud indicator tool. And it’s free on our website!
The design team behind this app were inspired by the principles of Benford’s law. This is an observation about the frequency distribution of leading digits in many real-life sets of numerical data, including financial accounts. In data that follows Benford’s law, leading digits are more likely to be low than high. So, given a large enough sample of financial data, numbers will start with a 9 on average 5% of the time, whereas numbers will start with a 1 more than 30% of the time.
To show this in action, the team created Benford’s Analyser app, a quick, high level check that can be used to help detect fraud through analysis of the numbers in financial statements. The free version allows you to apply the rule to leading digits in the latest filing for companies that submit annual and quarterly accounts to the Securities Exchange Commission (SEC).
As a statistical check, those using Benford’s law need to be aware of the implications of the results. Firstly, small sets of numbers are unsuitable for statistical analysis; secondly, a bad fit is not an indicator that there is fraud, rather that the numbers are not what would typically be expected. There are many company-specific reasons why this might be the case, of which fraud is just one. Those regulators, government agencies and auditors using the law may use this to decide where to look further.
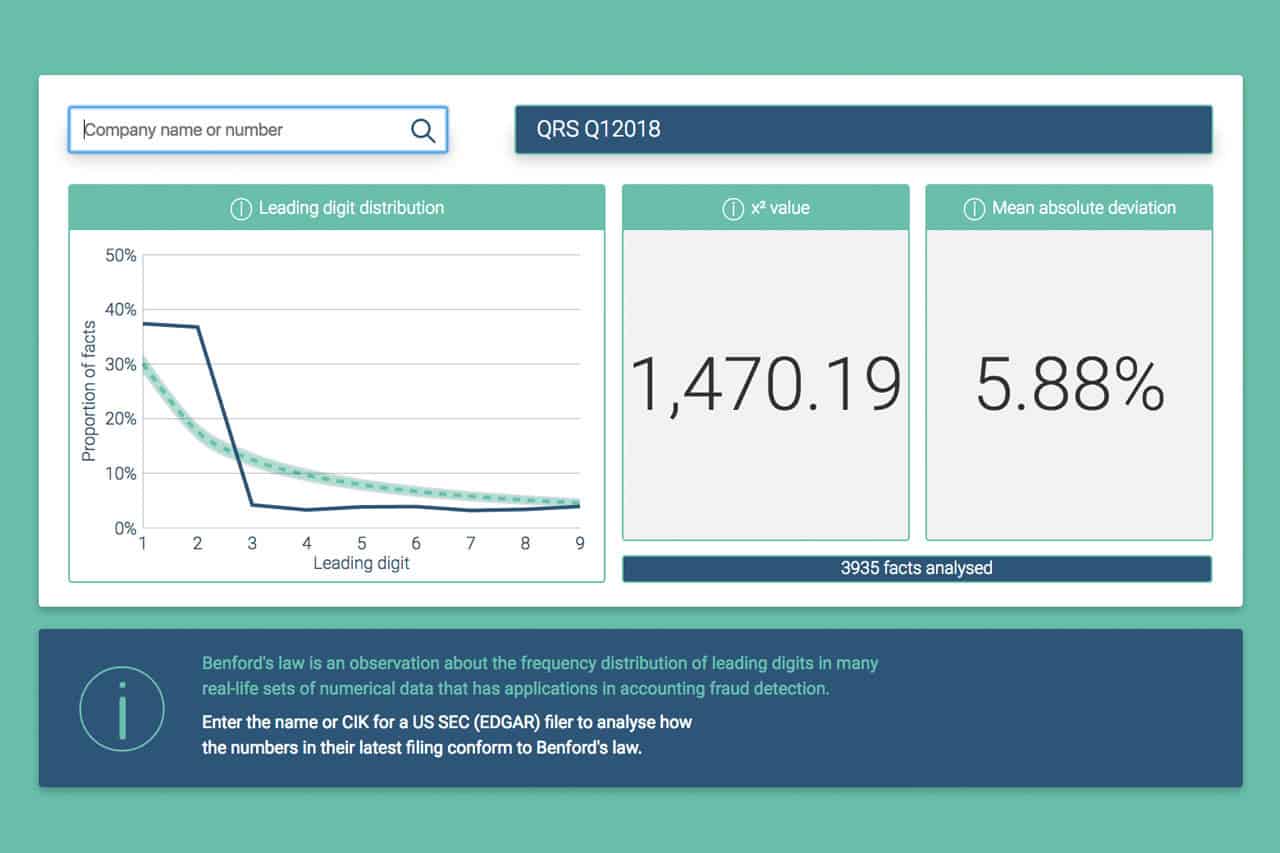
As shown in the images below, Benford’s Analyser creates a chart from filings that shows the anticipated distribution of first digits – based on Benford’s law – using the numbers reported in the company’s quarterly and annual financial statements.
In this platform tool, a chi-square value above 20.09 indicates that the numbers are only one per cent likely to appear in a normal set of accounts. The value shown (61.32) needs investigating to establish if fraud has taken place.
In some cases, though, there are too few numbers in the financial statement to apply this type of statistical analysis.
We’ve already had some great feedback for Benford’s Analyser from our latest rounds of innovation and customer outreach. Users were impressed with the immediacy of the model in creating tables for the filings under investigation.
Tagged financial data, such as XBRL reports, has become more readily available. CoreFiling is responding. We’re listening to our customers, bringing other automated checks to the market.
This is an archived post, please visit our homepage or contact us for more information.